


Top > In the News... > The New York Times: "Teach About Climate Change With These 24 New York Times Graphs"
 |
The current MnSTA Newsletter has an article that describes the NSTA position on the importance of teaching about climate change. MnSTA also has produced a position statement stating that "In teaching about climate change, it is important to focus instruction on the science concepts and evidence behind climate change".
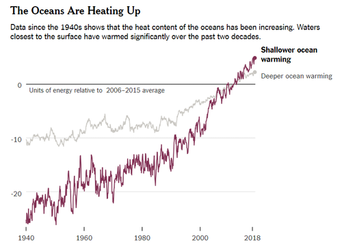
How do scientists display and analyze such evidence? Often it is through the use of graphs. In "Teach About Climate Change With These 24 New York Times Graphs", Michael Gonchar provides 24 New York Times graphs, along with suggestions on how to use them, to teach climate trends and what those trends tell us about how the earth is changing.
View the article here.
 Minnesota science teachers should know about: